Policy Poster:
Payday Lending’s Costs
Date: May, 2011
Categories: Data Visualization, Maps, Posters
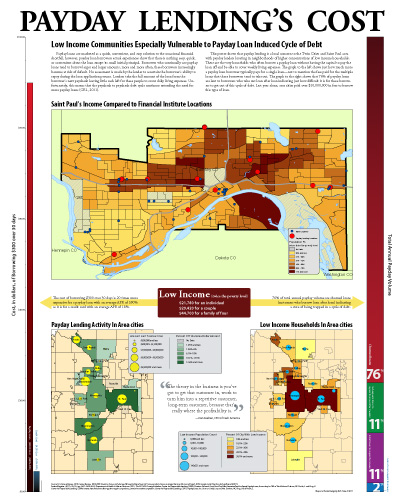
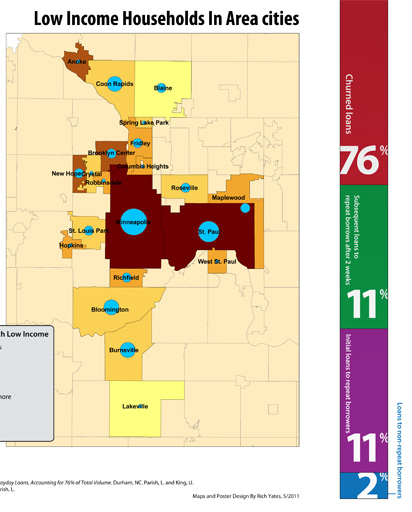
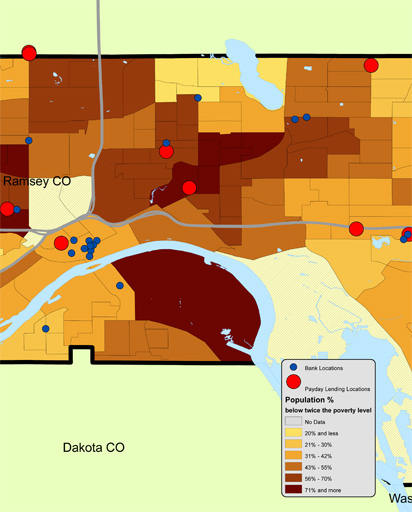
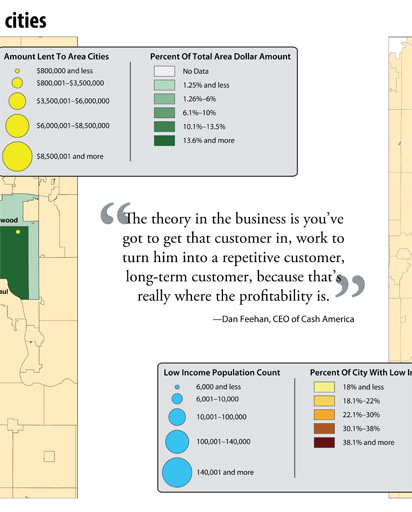
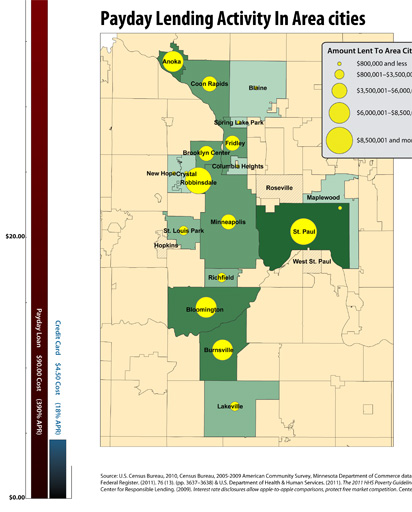
This poster shows that payday lending is a local concern to the Twin Cities and Saint Paul area with payday lenders locating in neighborhoods of higher concentrations of low income households. These are the very households who often borrow a payday loan without having the capital to pay the loan off and be able to cover weekly living expenses. The graph to the left shows just how much more a payday loan borrower typically pays for a single loan. The graph to the right shows that 76% of payday loans are lent to borrowers who take out loan after loan indicating just how difficult it is for these borrowers to get out of this cycle of debt. Last year alone, area cities paid over $10,000,000 in fees to borrow this type of loan.
Data visualization using multiple cloropleth maps to show data pertaining to neighborhoods and cities. The edges of this poster include data visualized as tall bar graphs to emphasize the discrepencies in the amount of money paid back to payday lenders and the percentage of repeat loans.
Policy Poster:
Payday Lending’s Costs
Date: May, 2011
Categories: Data Visualization, Maps, Posters
This poster shows that payday lending is a local concern to the Twin Cities and Saint Paul area with payday lenders locating in neighborhoods of higher concentrations of low income households. These are the very households who often borrow a payday loan without having the capital to pay the loan off and be able to cover weekly living expenses. The graph to the left shows just how much more a payday loan borrower typically pays for a single loan. The graph to the right shows that 76% of payday loans are lent to borrowers who take out loan after loan indicating just how difficult it is for these borrowers to get out of this cycle of debt. Last year alone, area cities paid over $10,000,000 in fees to borrow this type of loan.
Data visualization using multiple cloropleth maps to show data pertaining to neighborhoods and cities. The edges of this poster include data visualized as tall bar graphs to emphasize the discrepencies in the amount of money paid back to payday lenders and the percentage of repeat loans.
Payday Lending Costs Poster
Payday Lending Costs Poster
Payday Lending Costs Poster
Payday Lending Costs Poster
Payday Lending Costs Poster